FEATURED CONTENT
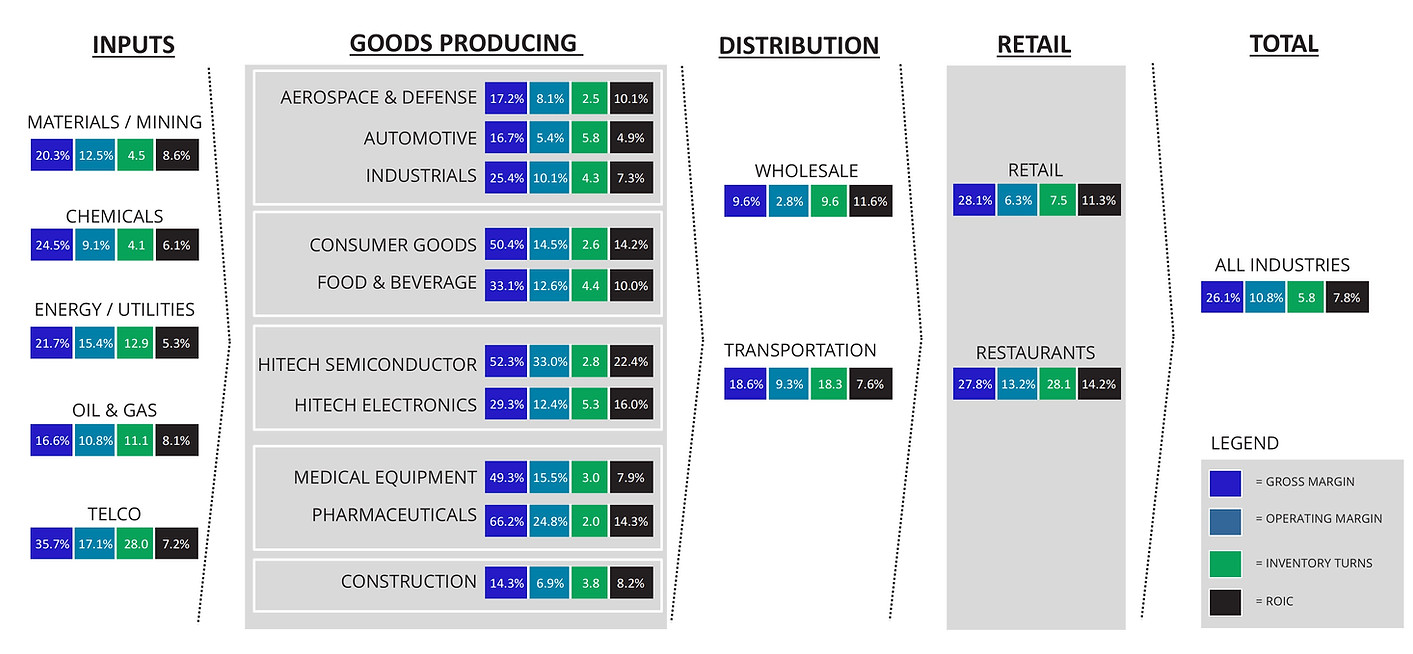
Industry Supply Chains - Operating Characteristics and Benchmarks

Gain an understanding of the operating characteristics of industries that make, move, store, and sell products (i.e. industries engaged in supply chain activities). The chart above provides a summary of four key operational metrics: gross margin, operating margin, inventory turns, and return on invested capital for more than 3000 companies across 19 industries. The complete analysis can be downloaded here.
Global Inventory Turnover Index

The global inventory turnover index tracks aggregate global inventory turns using a large data set of companies across 19 industries that constitute the goods producing, moving, and storing, selling parts of the economy. As stated in an earlier article, the index is used to understand how much inventory is present across the globe at a given point in time, and how it changes over time.
2023 Software Report
Gain an understanding of the business of software. This report provides comprehensive analysis of the business of software, including benchmarks for 290+ public software companies. It provides key insights, overall industry view, operational analysis, historical analysis, IPO analysis, and market cap analysis.

What is a Control Tower?
Gain an understanding of one of the hottest, yet misunderstood, topics in supply chain management in recent years. This white paper delivers an analysis of the foundational concepts and principles of control towers and how control towers add value to supply chains.
We believe in the power of software to transform supply chains
This transformation will come in the form of personalized supply chains of one, as business and the world are increasingly defined by economies of scope versus economies of scale. Will every company become a software company? No, but software will become an increasing part of every company's asset portfolio. The percentage of software assets to overall assets deployed for business usage will increase, meaning software will replace physical assets.
The Worldlocity Software Market Cap Index

The Worldlocity Software Market Cap Index tracks the average multiple of market capitalization to trailing-twelve-months revenue for large group of software companies that is representative of the entire software industry. The index includes 280+ global software companies. The index stood at 6.3 as of June 20, 2025. As you can see from the chart, the average and median saw a significant run up in 2020 and 2021, as the pandemic created a rising tide for all things digital The software market in 2025 is significantly different than it was just two years ago. Average growth rates have fallen significantly and today there is much more focus on balancing growth and profitability versus growth alone.
The World as a Supply Chain
Supply chains are critical to advancing companies, societies, and the world overall. Simple statistics show how the world is performing as a supply chain. This is useful not just for absolute analysis but as a reference point against individual companies and countries.
How Does Amazon Do It?
Amazon is the retail juggernaut of our day. Its supply chain prowess has catapulted it into the masters category of Gartner's top 25 supply chain rankings and fueled its growth towards a $200B company. Most people know Amazon has run a high-growth, nearly-zero-profit business model for more than twenty years, and has been rewarded for doing so by both customers and investors. It is also known that certain parts of its business are low margin and certain parts high margin. In some ways, it's a tale of two companies, albeit two that depend heavily on each other. What does its value chain look like?
Is Software Eating the World?
Over the past two decades, software has slowly but steadily been replacing physical assets throughout the supply chain. Marc Andreesen popularized this concept more than a decade in his then provocative discussion. It turns out that this is not just a thesis, but there is actual data to support it. The current trajectory shows that software is replacing approximately five to seven percentage points of physical assets per decade.


