Is Software Really Eating the World?
- Kelly J. Thomas
- Feb 20, 2019
- 6 min read
Updated: Dec 22, 2019

Software companies are richly valued. The average market cap-to-revenue ratio for public software companies with market capitalizations greater than $300 Million now hovers around 7.5 (see the report at this link). A lot of this is based not just on recent high rates of growth, but on the thesis that these rates of growth will continue long into the future. This is the Marc Andreessen thesis that “software is eating the world.”
Andreessen wrote his now much-quoted article more than seven years ago; in the article, he provided strong evidence in the form of software-centric companies, including the usual suspects that we know so well that they don’t even need to be repeated here. For those of us who have worked in software for a long time, this thesis seems axiomatic. The evidence is all around us and if it walks like a duck and quacks like a duck, then it must be a duck.
I have used the “software is eating the world” quote often and in various contexts. It is consistent with what I believe and what I do. But I sometimes encounter people from Missouri who say “show me.” Is there an empirical way to see if this is true, and by how much? How fast are businesses and economies moving to being software-driven, versus being asset-, labor-, and material-driven?
Direct Experience
My direct experience with software eating the world comes from designing, selling, and implementing supply chain software. The value proposition for buying this and other enterprise software is typically based on increasing sales, reducing costs, and reducing the need for capital investment.
For example, when a company buys production scheduling software, it does so to increase throughput or decrease inventory. The company reduces the need for a physical asset – either production equipment or inventory. Without the software investment, the company would otherwise have to invest in more production machinery, inventory, and labor.
In this example, the company may buy $100 worth of software to avoid having to invest $1000 in additional machinery. Machinery investments are also typically step functions – you have to purchase the whole capacity, whether or not you use it.
By making the software investment instead of the machinery investment, the digital intensity – or software intensity – becomes greater. Software becomes an increasing part of the asset base, or in other words, software has eaten that part of the physical world.
Viewed from this angle, we have been on a path of software eating the world for a long time. For example, the lowly punch card was embedded with digital information, and acted as the translation interface between humans, rules, and machines. It helped automate all sorts of labor-intensive bookkeeping, accounting, engineering, and other calculation-related functions (of course in doing so, it created an army of manual labor in the form of typists).
Prove It
As it turns out, our much-maligned government has an entire apparatus in place to capture data around such trends. And, as far as I can tell, it does this better and with more transparency and access than any other country in the world. I have been leveraging this data for quite some time; I find it interesting how closely macro-economic data matches micro data at the industry or company level.
The chart below (constructed using data from the Bureau of Economic Analysis) compares the growth rate of software with that of machinery and equipment in the U.S. economy for the past thirty years. From this you can quickly deduce that Andreessen is right not just anecdotally, but he’s right broadly speaking across the entire U.S. economy. And, it’s safe to say that the U.S. economy is a reasonable proxy for what is happening globally.
The other thing to notice on the chart is that the slope of the packaged software curve since 2010 is significantly steeper than the previous ten years but has yet to match the growth rates of the Internet bubble days of 1995-2000. This is possible validation that this is not a bubble and that the current growth rates are sustainable.

Pacman Chart
The following chart may be more revealing and is what I call the Pacman chart. It shows the investment percentages for machinery and equipment versus software for the past thirty years, in ten-year increments. Pacman (in this case, software), is consuming more and more of the investment donut.

There are a few cautionary notes on both charts above:
The software numbers do not include embedded software – in other words, the software that is carried along with the machinery and equipment, which has obviously also been growing. Likewise, they do not include a lot of software that is embedded in end-products. Apparently, these data are very hard to capture.
These data do not include physical structures such as buildings; they only include the equipment inside the buildings. The investment in physical structures is a huge number. Having said that, software has started to eat physical structures as well, as discussed below.
The BEA uses a far shorter depreciation timeframe for software than it does for machinery and equipment. This has the effect that software does not accumulate to the same extent that physical assets do; companies invest in it and then it depreciates fast, at least when compared to physical assets.
Digital Confusion
The noise associated with “digital transformation” is deafening. Every major consultancy and enterprise software company promises to take you to the promised land. For many companies, the short-term promised land is simply living to fight another day.
But digital transformation does not have to be confusing. It’s simply another way to enhance products and processes and to improve the labor, materials and assets needed to make products. The goal is the same it has always been – how to own your customers for the long term and do so profitably.
The diagram below is a simple way to look at digital transformation. Each business process has a set of inputs. These inputs are transformed into a value-add output. What’s different is that software is an increasing part of the inputs, and the transform function is no longer just electrical, mechanical, or chemical.
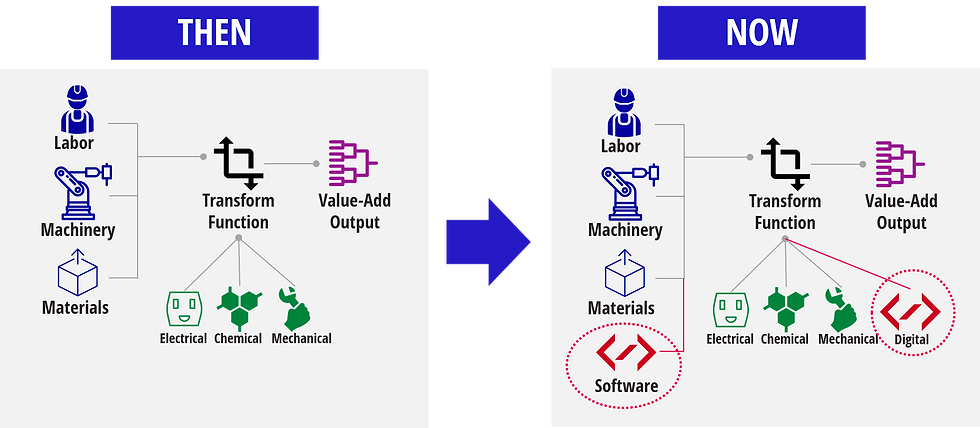
As companies do this across all their processes, they essentially become digital companies.
Machinery, Vehicles, and Buildings
The charts shown earlier do not include buildings, structures, and homes. This is a huge part of the deployed asset base across the world. Buildings are significantly behind consumer products in taking on digital content, and thus represent fertile ground for competition. Witness Amazon’s and Google’s competitive quest for domination of the software-enabled home. Buildings are long-life assets; thus, adding digital content is primarily a retrofit problem (the same is true of machinery, where a very high percentage of current IOT work is retrofit work).
Homes are where cars were in 1977 when the first microprocessor with 50K lines of code appeared in an Oldsmobile Toronado. Almost all of the incremental value-add of new cars for the past 15 years has been in electronics, most of which is software-driven. This is an easy-to-understand example of software eating a physical product.
Today’s modern high-end car has between 50 and 100 microprocessors and 100 million lines of code. And, these capabilities have moved quickly from luxury cars to economy cars, as nice-to-haves become must-haves.
It’s not hard to imagine the home of 2040 being likewise equipped. Of course, homes are long-life assets and, unlike cars, are not replaced regularly. Thus, while new homes will increasingly be outfitted with microprocessors and embedded software, the process of software eating buildings will be a continuous retrofit process.
Industrial companies, including automotive suppliers and makers of industrial equipment, are falling all over themselves to show investors that they are actually software companies, as they continue to augment their products with software. Today’s typical industrial company investor presentation is littered with statistics showing the number of software engineers they have, the maturity of their development processes, along with a heavy dose on the advanced technologies embedded in their product portfolios. When your company trades at 0.5 times sales and software companies trade at 7.5 times sales, you want a piece of the action.
You Ain’t Seen Nothin Yet
It has been said that data is the new oil. If data is the new oil, then software is the production equipment, labor, materials, transportation, and end products that process it and make it useful. Of course, the relationship between software and data is similar to that between oil and the internal combustion engine – one does not function without the other. And, to take the analogy a step further, each combination produces a lot of good, but can also create some nasty byproducts.
The process of substituting digital assets for physical assets will continue for a long time. However, there are limits – for example, you can’t live in a digital asset. The physical asset you live in will still be there, but its digital intensity will increase significantly. At some point, digital and physical will reach an equilibrium; but that appears a long way off in the future and by that time we will have moved on to the next great thing.


Comments