Evaluating Supply Chains Using the Value Above Replacement (VAR) Approach
- Kelly J. Thomas
- Jan 7
- 14 min read

Updated: Apr 2
A single metric reveals the best companies – and by extension – the best supply chains in each industry.

Introduction
Analytics have transformed American baseball over the past forty years. This is chronicled in the 2004 Michal Lewis book “Money Ball” and subsequent movie with the same name.
One of the statistics that has evolved over the years and become prominent in the past fifteen years is called Wins Above Replacement (WAR). WAR is a calculated metric (or index) for an individual player using various player performance metrics. WAR is intended to show – with one number – the value of each player both absolutely and relative to other players.
WAR is based on the simple premise that the number of wins defines success in baseball. WAR is intended to show how many more wins a player would bring to a team above what an average replacement player would. The average replacement player has performance metrics that are the league average in all categories.
In that sense, WAR shows how valuable an individual player is when compared to the average player in the league. For example, in 2025, Aaron Judge had a WAR of about 10, which was the highest in baseball. The WAR values of each player on a team are added together to give a total WAR for the team. This value is added to a baseline number of wins for a team full of average players to project the number of wins. It turns out that this approach is pretty accurate.
How Can We Apply This to Supply Chains?
This paper introduces an index called Value Above Replacement (VAR), which is the business equivalent of WAR. In this case, wins are replaced by value. What is value? Value is represented by a company’s market capitalization divided by its revenue (cap/revenue). Replacement value is the median market cap/revenue for the industry in which a company competes. VAR calculates an amount by which a company’s cap/revenue is expected to differ from the industry (above or below), based on important financial and operational metrics.
This paper asserts that companies with the highest VAR values are running the best supply chains.
The evaluation of each company is limited to the industry in which it competes, because that is essentially the “sport” in which they are competing. This also limits the comparison space, which helps with noise reduction in the data[1]. This analysis has found that an industry comparison space of about 150 – 200 companies is ideal. In some industries this analysis has more than this number, in some industries less. For reference, there are about 780 baseball players in major league baseball and WAR divides them into two categories (position players and pitchers).
While the VAR analysis is done within an industry, a normalized equal-weighting system is used across all industries so that there is relevance in comparing VARs across industries. That said, VAR does not account for the degree of difficulty in one industry versus another (in baseball’s WAR, this is called the “shortstop versus first baseman” problem). To account for such factors, baseball’s statisticians came up with a modified WAR called WAR+. WAR+ normalizes WAR across positions, league differences, and league quality among others. A similar VAR+ is not presented here; this is a topic for future contemplation.
With that as a preamble, let’s now talk about how VAR is constructed and what results it has yielded thus far.
The Data
The data behind this analysis is derived from five years of ongoing research and analysis of 19 supply chain industries[2]. The most recent summary report for this analysis can be downloaded here. The report appendix also contains definitions and formulas for the various metrics used in the formulation of VAR.
Table 1 below lists each industry, the number of companies, and the aggregate revenue of the companies in each industry and the aggregate revenue of the total data set. As shown, the data set includes more than 3300 companies representing more than $38T in revenue. The size of this data set is such that it is a strong proxy for all supply chains, and by extension, the goods-producing and consuming global economy.

Table 1 – Supply Chain Industries Included in Analysis
The Formula
VAR predicts how far a company should deviate from the industry median (the replacement value) in market cap/revenue, based on operational considerations only. It derives this by calculating how far a company deviates from the industry median (the replacement value) in the metrics categories found below. This is the general VAR equation.


Each category of VAR has one or more operational or financial metrics; each metric is compared to its replacement value, which is defined as the industry median. All the metrics, when compared to their replacement value, form a composite view of the performance of the company within the industry. This performance correlates directly with the company’s market performance, in other words, its market cap/revenue.

Figure 1 – Each Component of VAR is Calculated Relative to its Replacement Value
The following table outlines each component of VAR and the metrics used for each.

Note that the calculation for the replacement value for DEBITDA is reversed since lower values of leverage are positively correlated with market cap/revenue.
For a detailed discussion of how supply chain management relates to various elements of a company’s income statement, balance sheet, and cash flow statement see “Cost of Goods Sold (COGS) and Supply Chain Management.”
The resultant equation for VAR is as follows.


Each weight (w1, w2, w3, w4…) is foundationally based on the correlation coefficient between each variable of a company (Growth, Gross Margin, Operating Profit, Net Profit, Cash Flow…) and that company’s market cap / revenue. The weights are normalized for the range of each variable and for differences across industries. Each industry has its own correlation‑based weight structure, but the total weight mass is normalized to ensure comparability across industries.
The appendix of the Worldlocity Industry Benchmark Report contains detailed definitions and notes for all the metrics used in VAR.
Fundamentals-Based Index

It is important to note that – by design – VAR is a fundamentals-based index. It will not pick up on sentiment or other factors like long-term growth expectations, optionality, network effects, moats, regulatory tailwinds, megatrends (like AI), scarcity value, and other factors. In that sense, it is also free of opinions.
VAR will be directionally correct for companies exposed to such factors, but will undershoot (or overshoot) when compared to a company’s actual market VAR. On the other hand, these gaps reveal where markets are headed and could also reveal temporary value misalignment situations.
Why a Basket of ROI Metrics?
Multiple ROI metrics are used because different companies use different metrics to measure themselves and many companies use a modified version of one of the ROI metrics. For example, General Motors[3] uses a modified version of ROIC to measure itself.
Also, surprisingly, many companies perform better in one ROI metric like ROIC, but not in others, like ROA. A basket provides a composite view of return on investment. Furthermore, all ROI equations use some form of profitability (e.g. NOPAT, EBIT, Operating Profit, Net Profit) in their numerators; this has the effect of adding to the power of profitability, which in most industries is highly correlated with cap/multiple. That said, as will be discussed later, this approach may be reconsidered in later versions.
Simplicity and Explainability
Various mathematical approaches (e.g. linear, nonlinear, polynomial, and symbolic regressions) were employed to try to come up with a strong predictor equation using the input metrics. Each of these posed different problems. In the end, a simple approach turned out to be not just more easily explainable, but more accurate. The current approach involves primarily correlation analysis along with plain old addition, subtraction, multiplication, and division.
The more challenging problem, as with most analytical problems, is ensuring that the data is clean. The data set is made up of 3340 companies, 30+ data elements, 100 metrics, and 12 time buckets for each (a total of over 100M data elements). A single incorrect or outlier metric can throw off the averages for an entire industry data set. These outliers must be rooted out and either fixed or eliminated.
Finally, you’ll notice that we don’t include inventory turns, which is one of the more easily calculated operational metrics that relates directly to supply chains. This is because in every industry included in this analysis, inventory turns have a zero, near zero, or negative correlation to company performance. In many industries, 80% of the top performing companies have inventory turns that are greater than the industry median. This phenomenon reflects a broader trend in supply chain management – to one where supply chains have a profit-center focus, versus an historical cost-center focus. For a discussion of this phenomenon, see “Are Supply Chains Too Lean?”
Additional information on this phenomenon and the relationship between market performance and supply chain performance can also be found in the article “What type of supply chain strategy drives market cap leadership?” published in Supply Chain Quarterly (now called Supply Chain Xchange).
Limitations
VAR is a clean, interpretable, industry‑relative measure of operational excellence that highlights how much value a company creates above a replacement‑level peer — but it does not capture future expectations, sentiment, valuation, or long‑term optionality.
It’s important to note that:
The index is not perfect
It’s a model
It’s a lens, not a verdict
The George Box caution that “All models are wrong; some are useful” applies here. This is a useful model for revealing relative operational strength, predicted performance in the market, and by extension, supply chain management strength.
Tiering Framework
To make VAR intuitive and communicable, companies are grouped into performance tiers. These tiers mirror the structure of WAR in baseball and reflect meaningful differences in value creation.
MVP Tier — Generational Companies (Top ~1-2%)
These are the Babe Ruth–level performers of the corporate world. One point of clarification here – it is very difficult to win the MVP award more than once. However, many players are top 3 candidates for the MVP almost every year. There are other players who win the MVP and then simply fall back to elite status.
The current analysis is limited to the most recent results for all companies. The data set includes 10+ years of history, but the first release of VAR is done for the current year only. Future releases will include a multi-year view so that true “generational” companies can be identified.
In most industries, there is noticeable separation between the VAR values of MVPs and All-Stars; this makes the MVPs easy to identify.
All‑Star Tier — Elite Companies (Top ~8-10%)
All‑Star companies are the elite performers of their industries. They consistently deliver results well above replacement and demonstrate durable competitive advantages. They are the benchmarks others chase.
These are the companies that field the all-star team every year. Note: in baseball, there are some players who make the all-star team nearly every year; there are others that may only make it once or twice in their entire careers. So far, this analysis is limited to one-year of financial results; as shown below, as the analysis evolves, it will look at 3-5 years of data. That said, many of the companies identified in the all-star tier are recognizable enough that it’s easy to see them as perennial all-stars.
For reference, 64 players make baseball’s All-Star teams (32 for each team in each league). This is 8% of all players.
Starting Player Tier — Strong Companies (Top ~20%)
Starting Player‑tier companies are reliable value creators. They outperform the typical firm in their industry and demonstrate consistent, above‑replacement performance. In baseball, they are most of the starting players of winning teams
Replacement Tier — Typical Companies (Middle ~40–60%)
These companies represent the industry baseline. They perform close to the median and define the competitive environment against which all others are measured.
Below Replacement Tier — Underperforming Companies (Bottom ~40%)
These firms underperform relative to their industry’s baseline. They may face structural challenges or executional issues that prevent them from creating expected value.
Example Tiering for the Consumer Goods Industry
Figure 2 shows the distribution of VAR values within the Consumer Goods industry, along with representative tiers.

Why Tiering is Important
VAR is a directional metric, not a surgical one. It is not intended to distinguish between a VAR of 1.9 and 2.0 with false precision. Tiering provides:
Stability as the model evolves
Fairness for companies with near‑identical performance
Interpretability for non‑technical audiences
Flexibility for future refinement
As VAR matures, sharper numeric thresholds may emerge naturally — but tiering is the right approach at this stage.
Preliminary Results
The tables in this section reveal the preliminary results of VAR analyses for each of the 19 supply chain industries previously presented. We call the results preliminary because this is the first time they have been presented and there is still ongoing refinement.
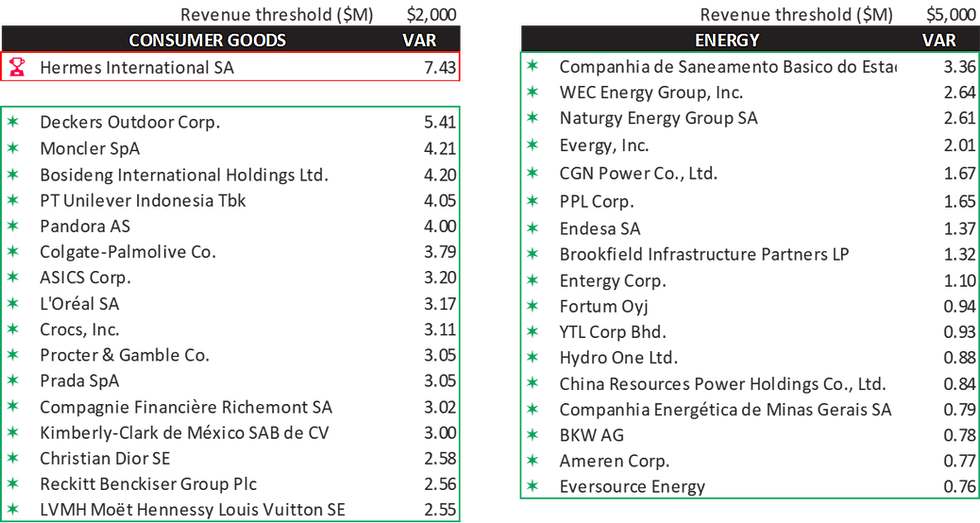
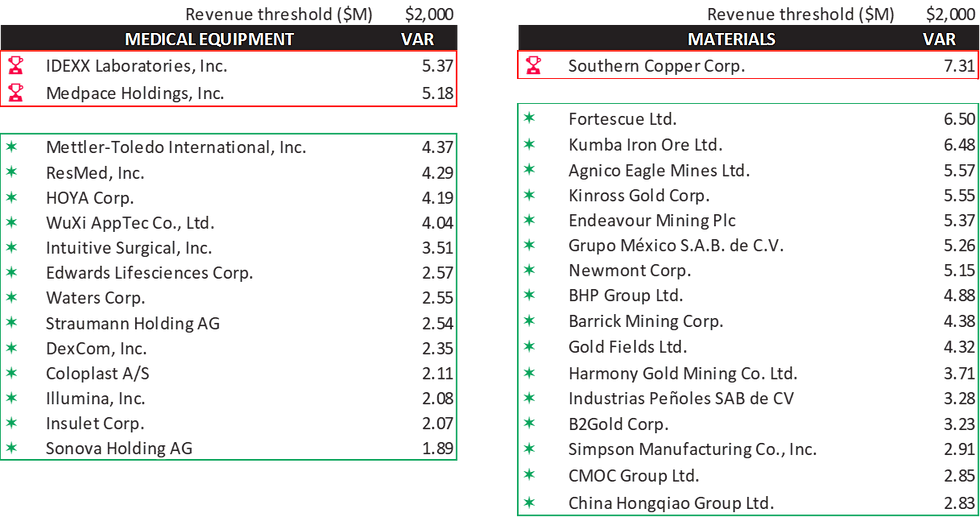
Shown below for each industry are the MVPs and the All-Stars (elite players). Note that a revenue threshold has been used for each industry to further reduce noise and to give a representative view of the analysis results. Note: in some industries, there is not enough separation to identify an MVP. In those cases, the top companies are listed as All-Stars.
The legend for each table is as follows:

MVPs are highlighted in red with the trophy icon along with their VAR value; All-Stars are highlighted in green with the star icon along with their VAR value.


There are no doubt anomalies among this lengthy list of industry companies. For example, in the Transportation industry, Wallenius Wilhelmsen shows strong operational numbers, resulting in a VAR of 4.9. However, its actual VAR is near zero and has been so for quite some time. Such situations require further investigation.
Calculated VAR (cVAR) Versus Actual VAR (aVAR)
Actual VAR is a company’s current market cap/revenue minus the median market cap/revenue for the industry in which it competes. Calculated VAR can differ significantly from actual VAR for various reasons. cVAR is still directionally correct, but it fails to pick up on various factors that may be influencing aVAR. But cVAR is not designed to pick up these factors.
For example, NVIDIA has a calculated VAR of 15.6, which is a monster number, putting it into Babe Ruth-like MVP territory. In fact, it is the highest calculated VAR of any company in the 3,340 companies in the data set. That said, its actual VAR is around 20. Why the difference?
The short answer is that cVAR does not pick up on trends like the significant AI boom and build-out that is affecting semiconductor demand and semiconductor company valuations. Nor does it want to. cVAR is designed to focus only on operational and financial metrics that impact valuations. Furthermore, it would be unprecedented for NVIDIA or any other company to maintain a cVAR of 15+ for a ten- or twenty-year period.
In the consumer goods industry, Proctor and Gamble has a cVAR of 3.1, very close to its actual value of 3.3, putting it in elite territory. On the other hand, Colgate-Palmolive has a cVAR of 3.8 versus an aVAR of 2.3. Both are directionally correct, but off in absolute terms. This could be because of myriad factors, including the trajectory of the business, the product portfolio, or macro-economic factors.
In the automotive industry[4] Tesla is an obvious outlier. Its market capitalization makes up nearly half the entire industry. However, as an automotive company its calculated VAR is 0.1, below that of Subaru, Toyota and three dozen other automotive companies. As many analysts have pointed out, it should not be evaluated as an automotive company, but as an AI, robotics or technology company. Thus, VAR has a way of focusing on performance within the industry, devoid of any other factors.
What About Other Supply Chain Rankings?
Some readers have asked how these rankings compare to other rankings that have been used over the years. The most well-know ranking is the annual Gartner Top 25 Supply Chains. Gartner does this for all industries and also has rankings for specific industries.
How do Gartner's top 25 supply chain companies fare when using the VAR analysis? The following is based on the Gartner 2025 Top 25 rankings:
Nine of the companies have VARs that place them in the All-Star category or above. Only one of these has an MVP-level VAR.
Eight of the companies have VARs that would put them in the Starting Player category (below Elite).
Seven of the companies have VARS that would put them at Replacement Level or below.
One of the Gartner companies is not included in the VAR analysis because it is considered a software company.
This raises some questions: can your supply chain be performing at a high level if the associated company is not winning in the market? Can your supply chain be performing at a high level if the company is not performing at a high level (relative to its peers) in the key areas of VAR (growth, margin, profitability, cash flow, ROI)? On this question, we lean towards "No."
Conversely, can your company have a high VAR value and yet have a supply chain that is not performing at a high level? On this question, we believe this is possible, but only for a temporary period of time.
Work to Do
There is still a lot of work to do. Below is a list of improvement areas.
Data – As with many things, data must be clean. To get strong and stable coefficients to be used in weightings, outliers and anomalies need to be cleaned. Much cleaning has already been done, but more can be done. Automated outlier and anomaly detection can help.
Dominant market position - VAR does not account for a company's market position. It looks only at operational metrics relative to replacement value (industry median). This is problematic in industries like Retail where companies such as Walmart and Costco have significant market share. This will be corrected in a future version of VAR (possibly as the first version of VAR+)
Correlation coefficients – Most industries have strong or reasonably strong correlation coefficients. However, Oil and Gas and Telecommunications are two with only moderate correlation coefficients. These two industries have the most noise and are the most global. Results must be viewed in this light.
Country of origin and financial market – this can have a big impact on a company’s multiple. There are numerous situations where calculated VAR exceeds actual VAR for companies in emerging markets, or in markets with much lower overall valuations.
Degree of difficulty – In American baseball, WAR does not differentiate between position difficulty (the “shortstop versus first baseman versus designated hitter problem”), nor several other factors. To normalize these factors, statisticians came up with a modified WAR called WAR+. WAR+ normalizes WAR across positions, league differences, and league quality among others. As VAR evolves, a VAR+ approach will be discussed and investigated.
Refinement of revenue filtering – revenue filtering is a blunt instrument; it is effective in eliminating the noise of smaller companies, particularly those in less established financial markets, but it has the impact of losing the diamonds in the rough that would rank highly in the VAR analysis. This can be corrected through proper outlier detection. Future reports will look at revenue tiering.
Balance sheet strength – measures of balance sheet risk are non-linear. For example, everything is fine up to a certain threshold and then risk grows exponentially from there. The simple linear use of Debt/EBITDA is useful, but it does not reflect this dynamic.
Basket of ROI metrics versus a more focused approach – future versions will evaluate whether using a subset of the ROI metrics – by industry – will yield better results.
Is it Accurate? Is it Useful?
Finally, is it accurate? Is it useful? So far, the index passes the sniff test. Many of the companies that rise to the top are obvious. Some are not so obvious. Some of the companies that are further back in the pack are still very strong, but lower on the list than some would think. Others perform higher than expected. It is also useful for identifying diamonds in the rough.
Further analysis using AI (ChatGPT 5 and Gemini) confirms that it is hard to argue with the rankings in each of the industries.
VAR is a clean, interpretable, industry‑relative measure of operational excellence that highlights how much value a company creates above a replacement‑level peer. This can be very useful in evaluating the operations of companies, and by extension their supply chain performance, albeit within the caveats and limitations outlined in this article.
Endnotes
Many of the industries have strong correlation coefficients. However, several industries still have significant noise due to their inherent nature, their global nature, and the current phase in which they are operating.
Supply chain industries are deemed those involved in the making, moving, and selling physical products. This includes input industries like materials and chemicals, goods producing industries like automotive and consumer goods, distribution industries, and retail.
Source: General Motors 2024 10K.
In the automotive industry, almost all automotive OEMs have financing operations, which lease and provide loans for vehicles. This "financing" debt is substantial and is included on the OEMs balance sheet. This is different from the debt used to fund operations. This analysis makes not attempt to adjust ROI calculations for this. However, comparisons across automotive OEMs are still relevant since they all have the same issue.


Comments